

The 2026 State of Vulnerabilities Report: Industry Insights
Key Takeaways Vulnerabilities Report Offers Key Industry Benchmarks How does your MTTR hold up against the industry average? And does your organization encounter more high/critical vulnerabilities than others in your industry? Those are just a few questions that our 2026 State of Vulnerabilities Report answers. The report analyzes more than 11,000 vulnerabilities surfaced through the […]

Key Takeaways
- Public sector organizations cut remediation of critical vulnerabilities by 34 days, dropping from 86 to 52 days.
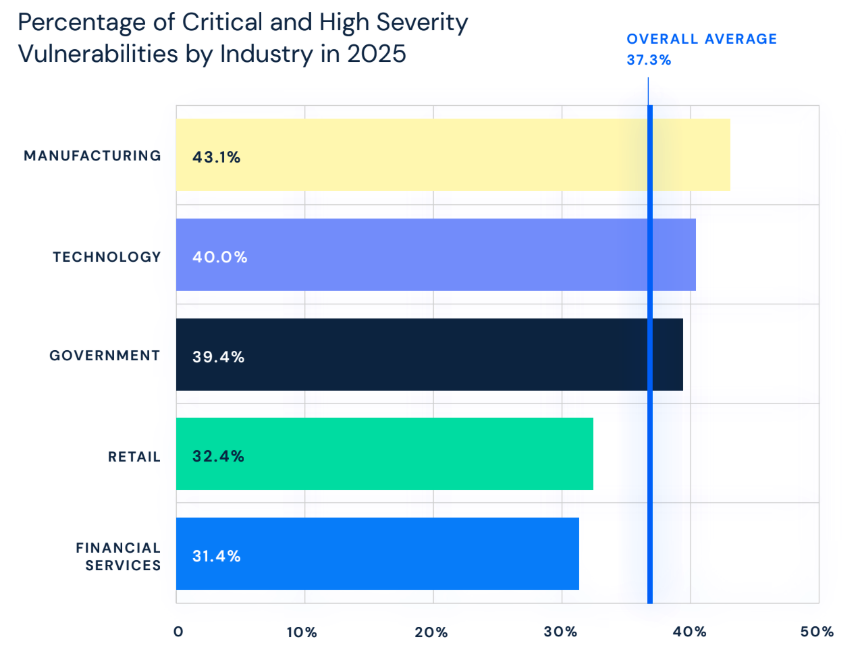
- Financial services kept critical and high-severity vulnerabilities to 31.4% of their overall findings, which was below the 37.3% cross-industry average.
- Technology firms saw a 14% spike in vulnerability volume, with critical-flaw fixes stretching from 74 to 98 days.
- High-severity XSS (476 instances) and critical SQL injection (197 instances) concentrated heaviest in the tech sector, exposing a high reliance on complex web applications and rapid code deployment
- Time, not volume, is the binding constraint: AI-accelerated adversaries are compressing recon timelines from days to hours.
Vulnerabilities Report Offers Key Industry Benchmarks
How does your MTTR hold up against the industry average? And does your organization encounter more high/critical vulnerabilities than others in your industry?
Those are just a few questions that our 2026 State of Vulnerabilities Report answers. The report analyzes more than 11,000 vulnerabilities surfaced through the Synack platform in 2025. For security leaders trying to justify headcount and budget in a cost-conscious environment, the data offers useful benchmarks. Across each sector, we focused on three core metrics:
- Average total assets (subdomains, web apps, IPs)
- Average days to remediate vulnerabilities by severity
- Most common vulnerability types by severity
Below is a closer look at three sectors with very different risk profiles: government, financial services, and technology.
1. Government: High-Value Targets, Faster Fixes
Government entities, from cities to large federal government agencies, are facing pressure to modernize and drive cost efficiencies. As they modernized and expanded their attack surface by 24% on average, public sector organizations saw a 10% year-over-year increase in total vulnerabilities discovered.
- Risk Profile: Critical and high-severity findings accounting for 39.4% of total vulnerability volume, higher than the cross-industry average of 37.3%.
- Key Weaknesses: Driven by sprawling, multi-agency environments, Authorization and Permissions failures were the most frequent findings. Authentication Management led the critical-severity category.
- Remediation Speed: Pushed by strict compliance mandates such as BOD 19-02, government agencies logged massive improvements—reducing remediation times for critical vulnerability remediation by 34 days (dropping from 86 to 52 days).
2. Financial Services: Strong Defense and Rapid Patching
Operating under rigid global regulations, the financial sector delivered a strong defensive performance. While total discovered vulnerabilities fell by 6%, severe risks ticked slightly upward.
- Risk Profile: Financial institutions successfully limited their critical and high-severity risk concentration to 31.4%, keeping it well below the cross-industry average of 37.3%.
- Key Weaknesses: Authorization and Permissions and Cross-Site Scripting (XSS) were the most common issues. However, the sector still logged 144 critical SQL Injection instances, exposing risks in API and transaction layers.
- Remediation Speed: FinServe firms accelerated remediation in 2025, shaving 19 days off critical vulnerability remediation to achieve a 36-day average.
3. Technology: High Velocity, High Complexity
Organizations in the tech sector experienced a 14% spike in total vulnerability volume, potentially due to rapid development pipelines and expanding API ecosystems.
- Risk Profile: Technology organizations showed a high proportion of critical and high-severity vulnerabilities, at 40.0% of total findings.
- Key Weaknesses: The sector logged 476 high-severity XSS instances and 197 critical SQL Injection instances—the highest concentrations in the report.
- Remediation Speed: While teams fixed high-severity flaws 13 days faster than the previous year, the timeline for critical flaws rose from 74 to 98 days, reflecting the difficulty of remediating vulnerabilities with technical debt and high system complexity.
What the Data Tells Us
A one-size-fits-all approach to vulnerability management is no longer viable. Government agencies are accelerating under regulatory pressure. Financial services are leaning on mature continuous validation. Technology companies are paying the price for speed in their critical-flaw timelines. Wherever your team sits on that spectrum, benchmarks matter. They help you make the case for resources, prioritize what to fix first, and measure whether your program is keeping pace with adversaries who have already shifted.
As the window between vulnerability disclosure and patch continues to narrow, we’re working with organizations to deploy Sara AI Pentesting alongside the Synack Red Team for coverage at machine speed with human validation. AI finds more. Humans prove what matters.
To see the full breakdown, including additional sectors, check out The 2026 State of Vulnerabilities Report.
Frequently Asked Questions
What is the 2026 State of Vulnerabilities Report?
It’s an annual analysis of more than 11,000 vulnerabilities surfaced by the Synack PTaaS platform in 2025. The report breaks down vulnerability volume, vulnerability types, and remediation speed by industry so security leaders can benchmark their program against peers.
Which industries does the report benchmark?
The full report covers government, financial services, technology, manufacturing, and retail.
Why is MTTR the metric to watch in 2026?
Adversaries are using AI to compress reconnaissance from days to hours. Every day a critical vulnerability stays open is a day attackers can use it. MTTR is now the most direct measure of whether your program is keeping pace.
Where can I get the full report?